


TDE - T Desktop Enhancements
chip2003


Source (link to git-repo or to original if based on someone elses unmodified work):
1.3
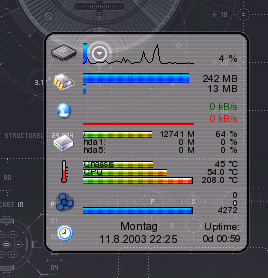
- Added alternate keramik background
- Added additional on-click info: CPU, Kernel, Memory and Voltage info by clicking on an icon
- Changed network icon
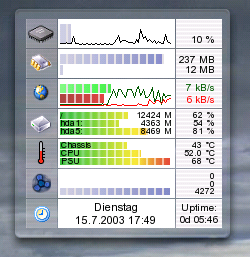
1.2
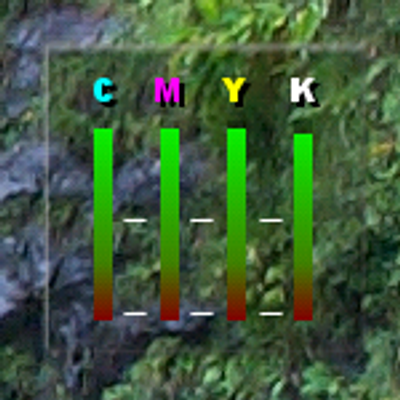
- Added bars
- Added network traffic in and out seperately
- Integrated disk space meter
- Integrated multiple values (disks, temperatures, fans)
1.1
- Optimized icons
- Optimized the graph's ranges
- Corrected text alignment


More Karamba & Superkaramba from chip2003:
Other Karamba & Superkaramba:

Ratings & Comments
71 Comments
I reworked the setup file to make it easier to understand where values should be changed and how the thing should be organised. Also, Ideas for improvement - Have the X and Y values using a variable rather than a number, for really simple adjustment - Having a function to completely remove a section (eg: remove the Fans section - doesn't work on my machine) - maybe readjust all the heights automatically ? (may be easily possible if the two above were re-done?) - Issue remains of the background size... Here is my re-org of the setup file: Please bear in mind I had to resize the background file (ker9.png) because of additional partitions - Keramik's is better for this obviously I have also left Fans and Temperature even if they serve no purpose in my PC. Just use if it you want it. # written by Chip 2003 ################## BOX SIZE AND BACKGROUND SETUP #################### # Box # Size: x=230, y=294 # KARAMBA X=500 Y=200 W=230 H=294 interval=1000 locked=false image x=8 y=0 path="image/ker9b.png" ################## BOX SIZE AND BACKGROUND SETUP #################### ################################ CPU ################################ # CPU # Position: x=20-210, y=20-40 # # CPU: bar x=54 y=20 w=110 h=20 vertical=false path="image/bar_p.png" sensor=cpu interval=500 graph x=54 y=20 w=110 h=20 color=0,0,0 sensor=cpu interval=1000 text x=210 y=30 sensor=cpu format="%v %" align=right color=0,0,0 fontsize=9 font="Arial" interval=1000 # ##################################################################### # Icon: image x=20 y=20 path="image/cpu.png" # # Icon Interactivity: # If you set 'Toggle locked position' in the theme, it works with a single click instead of a double click # The following lines parse diverse files at /proc and display additional system info in a box. # clickarea x=20 y=20 w=30 h=15 onclick="kdialog --msgbox '%v' sensor=program program="echo CPU:;grep 'model name' /proc/cpuinfo| sed -n '/: /s/.............//p';grep MHz /proc/cpuinfo| sed -n '/MHz/s/...........//p'|sed 's/\..../ MHz/';grep 'cache size' /proc/cpuinfo| sed -n '/: /s/.............//p'|sed 's/KB/KB Cache/';echo Kernel:; cat /proc/sys/kernel/osrelease" ################################ CPU ################################ ############################### MEMORY ############################## # Memory # Position: x=24-210, y=50-71 # # Used Memory: bar x=54 y=50 w=110 h=10 vertical=false path="image/bar_p.png" sensor=memory text x=210 y=50 sensor=memory format="%um MB" align=right color=0,0,0 fontsize=9 font="Arial" # graph x=54 y=50 w=110 h=20 color=0,0,0 sensor=memory # # Used Swap: bar x=54 y=61 w=110 h=10 vertical=false path="image/bar_p.png" sensor=memory format="%us" text x=210 y=60 sensor=memory format="%us MB" align=right color=0,0,0 fontsize=9 font="Arial" # graph x=54 y=50 w=110 h=8 color=0,0,255 sensor=memory # ##################################################################### # Icon: image x=24 y=50 path="image/mem.png" # # Icon Interactivity: # If you set 'Toggle locked position' in the theme, it works with a single click instead of a double click # The following lines parse diverse files at /proc and display additional system info in a box. # clickarea x=20 y=45 w=30 h=20 onclick="kdialog --msgbox '%v' sensor=program program="cat /proc/meminfo |grep -v total:|grep -v Mem:|grep -v Swap:" ############################### MEMORY ############################## ############################## NETWORK ############################## # # HELP: Network (eth0) # change the "device" value to "ppp0" to monitor ppp0 (Analogue Modem) # the settings are are for a 100Mbps LAN # This means, the graph is showing a range of 0 to 100 kB/s. # Set the 'max' value below to a lower measure, f.e. 15 (kB/s) for Analogue Modem (56k) # ##################################################################### # Network # Position: x=27-210, y=80-101 # # In: bar x=54 y=80 w=110 h=9 vertical=false path="image/bar_gp.png" sensor=network device="eth0" format="%in" max=100 interval=250 graph x=54 y=80 w=110 h=20 color=0,90,0 sensor=network device="eth0" format="%in" max=100 interval=250 text x=210 y=78 sensor=network device="eth0" format="%in kB/s" align=right color=0,90,0 fontsize=9 font="Arial" interval=250 # # Out: bar x=54 y=90 w=110 h=9 vertical=false path="image/bar_rp.png" sensor=network device="eth0" format="%out" max=100 interval=250 graph x=54 y=81 w=110 h=20 color=255,0,0 sensor=network format="%out"device="eth0" max=100 interval=250 text x=210 y=90 sensor=network device="eth0" format="%out kB/s" align=right color=255,0,0 fontsize=9 font="Arial" interval=250 # ##################################################################### # Icon: image x=27 y=80 path="image/net.png" # # Icon Interactivity: # If you set 'Toggle locked position' in the theme, it works with a single click instead of a double click # The following lines parse diverse files at /proc and display additional system info in a box. # # HELP: Network info # Warning: # For security reasons, you shouldn't attempt to do the following if you don't know what you're doing! # You may accidently give some users the right to change the config of your network devices. # This is a security risk for the internet. # # # To use this, you have to be root or have the right to execute 'ifconfig' ! # To set the right to run ifconfig as non-root, do the following: # - First, type ifconfig as the user to see it is already allowed. # If not: # - run: 'su -' then enter the root password (To become SuperUser) # - run: 'ln -s /sbin/ifconfig /bin/ifconfig' (create a symbolic link so you don't damage your original file) # - run: 'chown YOURUSERNAME /bin/ifconfig' (Change YOURUSERNAME for the user who will be allowed to do this) # Then remove the '#' from in front of the line below. # It should work then. # clickarea x=20 y=80 w=30 h=18 onclick="kdialog --msgbox '%v' sensor=program program="ifconfig|grep 'RX bytes'" ############################## NETWORK ############################## ################################ HDD ################################ # # HELP: HDD (or Partitions) # To add further disks here, copy one of the following sections and adapt the # values for position (x,y from upper left corner) and the disks mountpoint. # Eventually, you may want to make the bar a little smaller, to fit the disks area in the theme. # Just set the value 'h' (height) to a smaller number for all disk sections. # If you have 4 disks for example, h=4 and each x5 pixels higher than the one before should work. # ##################################################################### # HDD # Position: x=24-210, y=104-155 # # Icon: image x=24 y=108 path="image/hdd.png" # # Disk 1: bar x=54 y=108 w=110 h=7 vertical=false path="image/bar_cp.png" sensor=disk mountpoint="/" text x=167 y=106 sensor=disk mountpoint="/" format="%u M" align=right color=0,0,0 fontsize=8 font="Arial" text x=210 y=106 sensor=disk mountpoint="/" format="%up %" align=right color=0,0,0 fontsize=8 font="Arial" text x=54 y=106 value="/" color=0,0,0 align=left fontsize=8 font="Arial" # # Disk 2: bar x=54 y=116 w=110 h=7 vertical=false path="image/bar_cp.png" sensor=disk mountpoint="/home" text x=167 y=114 sensor=disk mountpoint="/home" format="%u M" align=right color=0,0,0 fontsize=8 font="Arial" text x=210 y=114 sensor=disk mountpoint="/home" format="%up %" align=right color=0,0,0 fontsize=8 font="Arial" text x=54 y=114 value="home" color=0,0,0 align=left fontsize=8 font="Arial" # # Disk 3: bar x=54 y=124 w=110 h=7 vertical=false path="image/bar_cp.png" sensor=disk mountpoint="/mnt/shared" text x=167 y=122 sensor=disk mountpoint="/mnt/shared" format="%u M" align=right color=0,0,0 fontsize=8 font="Arial" text x=210 y=122 sensor=disk mountpoint="/mnt/shared" format="%up %" align=right color=0,0,0 fontsize=8 font="Arial" text x=54 y=122 value="shared" color=0,0,0 align=left fontsize=8 font="Arial" # # Disk 4: bar x=54 y=132 w=110 h=7 vertical=false path="image/bar_cp.png" sensor=disk mountpoint="/mnt/shared2" text x=167 y=130 sensor=disk mountpoint="/mnt/shared2" format="%u M" align=right color=0,0,0 fontsize=8 font="Arial" text x=210 y=130 sensor=disk mountpoint="/mnt/shared2" format="%up %" align=right color=0,0,0 fontsize=8 font="Arial" text x=54 y=130 value="shared2" color=0,0,0 align=left fontsize=8 font="Arial" # # Disk 5: bar x=54 y=140 w=110 h=7 vertical=false path="image/bar_cp.png" sensor=disk mountpoint="/mnt/win2k" text x=167 y=138 sensor=disk mountpoint="/mnt/win2k" format="%u M" align=right color=0,0,0 fontsize=8 font="Arial" text x=210 y=138 sensor=disk mountpoint="/mnt/win2k" format="%up %" align=right color=0,0,0 fontsize=8 font="Arial" text x=54 y=138 value="win2k" color=0,0,0 align=left fontsize=8 font="Arial" # # Disk 6: bar x=54 y=148 w=110 h=7 vertical=false path="image/bar_cp.png" sensor=disk mountpoint="/mnt/winxp" text x=167 y=146 sensor=disk mountpoint="/mnt/winxp" format="%u M" align=right color=0,0,0 fontsize=8 font="Arial" text x=210 y=146 sensor=disk mountpoint="/mnt/winxp" format="%up %" align=right color=0,0,0 fontsize=8 font="Arial" text x=54 y=146 value="winxp" color=0,0,0 align=left fontsize=8 font="Arial" ################################ HDD ################################ ########################### TEMPERATURES ############################ # # HELP: Temperature sensors # "type" depends on your mainboard # Range is up to 70 degrees celsius. # Change 'max' value if needed. # ##################################################################### # Temperatures # Position: x=29-210, y=160-185 # # Chassis Temperature: bar x=54 y=162 w=110 h=7 vertical=false path="image/bar_cp.png" sensor=sensor type="temp1" max=70 text x=210 y=160 sensor=sensor type="temp1" format="%v °C" align=right color=0,0,0 fontsize=8 font="Arial" text x=55 y=160 value="Motherboard" color=0,0,0 align=left fontsize=8 font="Arial" graph x=54 y=234 w=110 h=20 color=0,0,0 sensor=sensor type="temp1" max=70 interval=5000 # # CPU Temperature: text x=210 y=168 sensor=sensor type="temp2" format="%v °C" align=right color=0,0,0 fontsize=8 font="Arial" text x=55 y=168 value="CPU" color=0,0,0 align=left fontsize=8 font="Arial" bar x=54 y=170 w=110 h=7 vertical=false path="image/bar_cp.png" sensor=sensor type="temp2" max=70 graph x=54 y=134 w=110 h=20 color=0,0,0 sensor=sensor type="temp2" max=70 interval=5000 # # PSU Temperature: # text x=210 y=176 sensor=sensor type="temp3" format="%v °C" color=0,0,0 align=right fontsize=8 font="Arial" # text x=55 y=176 value="PSU" color=0,0,0 align=left fontsize=8 font="Arial" # bar x=54 y=178 w=110 h=7 vertical=false path="image/bar_cp.png" sensor=sensor type="temp3" max=70 # graph x=54 y=235 w=110 h=20 color=0,0,0 sensor=sensor type="temp3" max=70 interval=5000 # ##################################################################### # Icon: image x=29 y=161 path="image/thermometer_k.png" # # Icon Interactivity: - VOLTAGES (Uses Sensors) # If you set 'Toggle locked position' in the theme, it works with a single click instead of a double click # The following lines parse diverse files at /proc and display additional system info in a box. # clickarea x=20 y=164 w=30 h=20 onclick="kdialog --msgbox '%v' sensor=program program="sensors| grep ' V '" ########################### TEMPERATURES ############################ ############################## FANS ################################# # # HELP: Sensor Fans # "type" depends on your mainboard # Range is up to 5000 rpm. # Change 'max' value if needed. # ##################################################################### # Fans # Position: x=26-210, y=188-216 # # Icon: image x=26 y=193 path="image/fan_s.png" # # Fan 1: text x=210 y=188 sensor=sensor type="fan1" format="%v" align=right color=0,0,0 fontsize=8 font="Arial" text x=55 y=188 value="Fan 1:" color=0,0,0 align=left fontsize=8 font="Arial" bar x=54 y=190 w=110 h=7 vertical=false path="image/bar_p.png" sensor=sensor type="fan1" # graph x=54 y=191 w=110 h=20 color=0,0,0 sensor=sensor type="fan1" interval=5000 # # Fan 2: text x=210 y=197 sensor=sensor type="fan2" format="%v" align=right color=0,0,0 fontsize=8 font="Arial" text x=55 y=197 value="Fan 2:" color=0,0,0 align=left fontsize=8 font="Arial" bar x=54 y=199 w=110 h=7 vertical=false path="image/bar_p.png" sensor=sensor type="fan1" # graph x=54 y=201 w=110 h=20 color=0,0,0 sensor=sensor type="fan2" interval=5000 # # Fan 3: text x=210 y=207 sensor=sensor type="fan3" format="%v" align=right color=0,0,0 fontsize=8 font="Arial" text x=55 y=207 value="Fan 3:" color=0,0,0 align=left fontsize=8 font="Arial" bar x=54 y=209 w=110 h=7 vertical=false path="image/bar_p.png" sensor=sensor type="fan3" # graph x=54 y=210 w=110 h=20 color=0,0,0 sensor=sensor type="fan3" interval=5000 ############################## FANS ################################# ############################## TIME ################################# # Time # Position: x=28-193, y=222-234 # # Icon: image x=28 y=226 path="image/time.png" # #Time text x=110 y=222 sensor=time format="dddd" align=center color=0,0,0 fontsize=10 font="Arial" text x=110 y=234 sensor=time format="dd.M.yyyy h:mm" align=center color=0,0,0 fontsize=10 font="Arial" # # Uptime: text x=193 y=222 value="Uptime:" color=0,0,0 align=center fontsize=9 font="Arial" text x=193 y=234 sensor=uptime format="%dd %H:%M" align=center color=0,0,0 fontsize=9 font="Arial" ############################## TIME #################################
Hello... I have problems with TMon and kernel 2.6. I can`t get temperatures to show up on theme... I have the latest lm_sensors but that doesn`t solve the thing. What to do? Thanks, LeVaK
Maybe it's not a kernel matter, try editing /etc/sensors.conf, look for your chip and change the temperature labels to temp1 and temp2. hope this helps
Hi, i like this theme pretty much but i have a complain about it. It keeps always on top of all my other applications, i would like it to attach to my desktop so it would be visible only there. Any way to do it?
Same problem here. After i've updated my Redhat9 to Fedora core test i've noticed that this theme is always on top... i don't know... perhaps fedora kernel or 2.6.x ? Or KDE 3.2? I really don't know... please post some suggestions. Thx
To fix this problem, edit karamba.cpp and change line 2246 from KWin::setType(winId(), NET::Dock); to... // KWin::setType(winId(), NET::Dock); You will have to recompile Superkaramba.
It works thanx man a lot !
Hello, I had one question for you I'm a newbie and I don't know how to run sensors on my box. I had Kernel 2.4.22 on my slacware 9.1 and everything goes right but now I have the new kernel, and sensors doesn't work. I built them in kernel but when i do root@laptop:/# sensors bash: sensors: command not found root@laptop:/# I don't know, does anyone know an how-to guide?
sensors and gkrellm works fine... via686a-isa-6000 Adapter: ISA adapter Algorithm: ISA algorithm CPU core: +1.45 V (min = +1.79 V, max = +2.18 V) ALARM I/O: +3.19 V (min = +2.95 V, max = +3.62 V) +5V: +4.84 V (min = +4.47 V, max = +5.49 V) +12V: +11.33 V (min = +10.79 V, max = +13.18 V) CPU Fan: 7031 RPM (min = 3000 RPM, div = 2) P/S Fan: 4560 RPM (min = 3000 RPM, div = 2) SYS Temp: +27.9
Has anyone got this going under kernel 2.6? This kernel has i2c built into it, and all the sensor readings go to /sys instead of /proc
install latest lm_sensors
Is it possible to exclude nice time in the CPU monitor?
ok so even as root it wouldnt find mod probe for some reason and then i tried doing it with the path so i did /sbin/modprobe i2c-proc and that seemed to work it didnt say anything in console but it just brought me back. then when i went to run sensors it said no sensors detected. HELP? here is what all happened. [root@Polaris andy]# modprobe bash: modprobe: command not found [root@Polaris andy]# /sbin/modprobe i2c-proc [root@Polaris andy]# sensors No sensors found! any suggestions?
This is quite strange. I have no idea whats wrong with your distro. Whit SuSE it works. Please look at the very top of these comments. There I described how the whole sensors-thing is to set up. I'm not an expert in sensors, I just use it. So, if the steps I described don't work, you should have a look at the sensors docu. Good luck! Chip
help!!! ok i am using JAMD linux and this theme for superkaramba looks awesome but im a super n00b and for soem reason cant get hardly anythign to work. CPU usage seems to work fine but not really anything else. I DO have sensors installed but whenever I type modprobe i2c-proc console tells me taht modprobe does not exist or is not a valid command. So i cant even run the sensors program to get the right values for the sensors. Also I changed the theme file so it shoudl work for eth 0 but it still shows nothing. I closed the theme or whatever and restarted it and still nothing... any helpw ould be great, thanks so much.
Make sure you are root. modprobe can't be executed by a normal user ;-) Chip
Hey, I really enjoy your theme. However, I seem to have lost it! I'm not sure what exactly happened, but I'm under the impression that when I try to open it, it opens at a location off of the screen (karamba location is still at X=500 Y=200 though). If you could help me, it would be greatly appreciated. I would simply download it again, but I did quite a bit of work with it.
Thanks :) There's a config file at ~/.superkaramba/ called tmon-1.rc or similar. It's written when tmon is started the first time. Just delete it and start tmon again. It should work. Chip
help!!! ok i am using JAMD linux and this theme for superkaramba looks awesome but im a super n00b and for soem reason cant get hardly anythign to work. CPU usage seems to work fine but not really anything else. I DO have sensors installed but whenever I type modprobe i2c-proc console tells me taht modprobe does not exist or is not a valid command. So i cant even run the sensors program to get the right values for the sensors. Also I changed the theme file so it shoudl work for eth 0 but it still shows nothing. I closed the theme or whatever and restarted it and still nothing... any helpw ould be great, thanks so much. -Andy
hi, it's cool, but I need a little of help. I can't find temp1, temp2 ... in /dev or any place. I installed lm_sensors and ran sensors-detect and load the modules, all that things but do not exist this sensors files. what I need? i have redhat 9 thanks
Run sensors and look at its output, how the temperatures are named (like temp1 or similar). These names need to be configured in the tmon.theme file. Chip
Is it possible to show individual CPU loads?
Yes, according to Superkaramba How-to, it is possible. In the theme file, there's a section called CPU. Copy it, adjust x and y coordinates and add cpu=0 or cpu=1 at each line (beginning with bar, graph and text) behind sensor=cpu. For further information, look at http://netdragon.sourceforge.net/?page=Sensors Regards, Chip
Why do almost all icons in KDE have to be so damn cartoonish or just butt-ugly? This seems especially true for "new" apps people make. Could someone please address these issues or at least think about some GUI changes folks?
This is when lm_sensors packages are installed and /etc/modules.conf is modified to load the needed modules. I had the same "sensor" problem... You have to match the string in the .theme file with the stdout of the "sensor" command. For example, I had an "Temp1/MB", "Temp2/CPU"... Just modifiying the .theme file when "temp1" appears, and that's all. The author writes "this depends on your motherboard" in that section... I made a personalized version, because I have one CPU and one FAN sensor working; I've modified the width of the bar, the size of the font, and so on. It's too easy to do! One thing I'd like is to click and show more info, like in CPU section... And maybe one more space to disks (up to 4 partitions). Awesome!!!