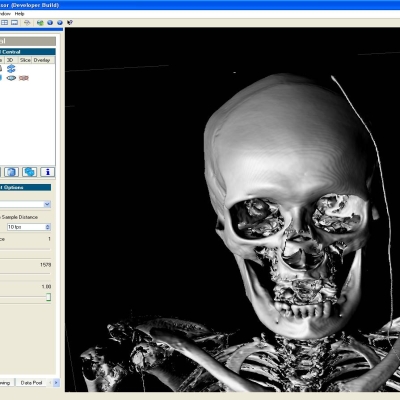
Julius Model Viewer
juergenmueller

Homepage
Source (link to git-repo or to original if based on someone elses unmodified work):
Version for KDE Frameworks 6
Fitting of too much parameters is prevented
Corrected setting of page format combo box to defaults in setting dialog
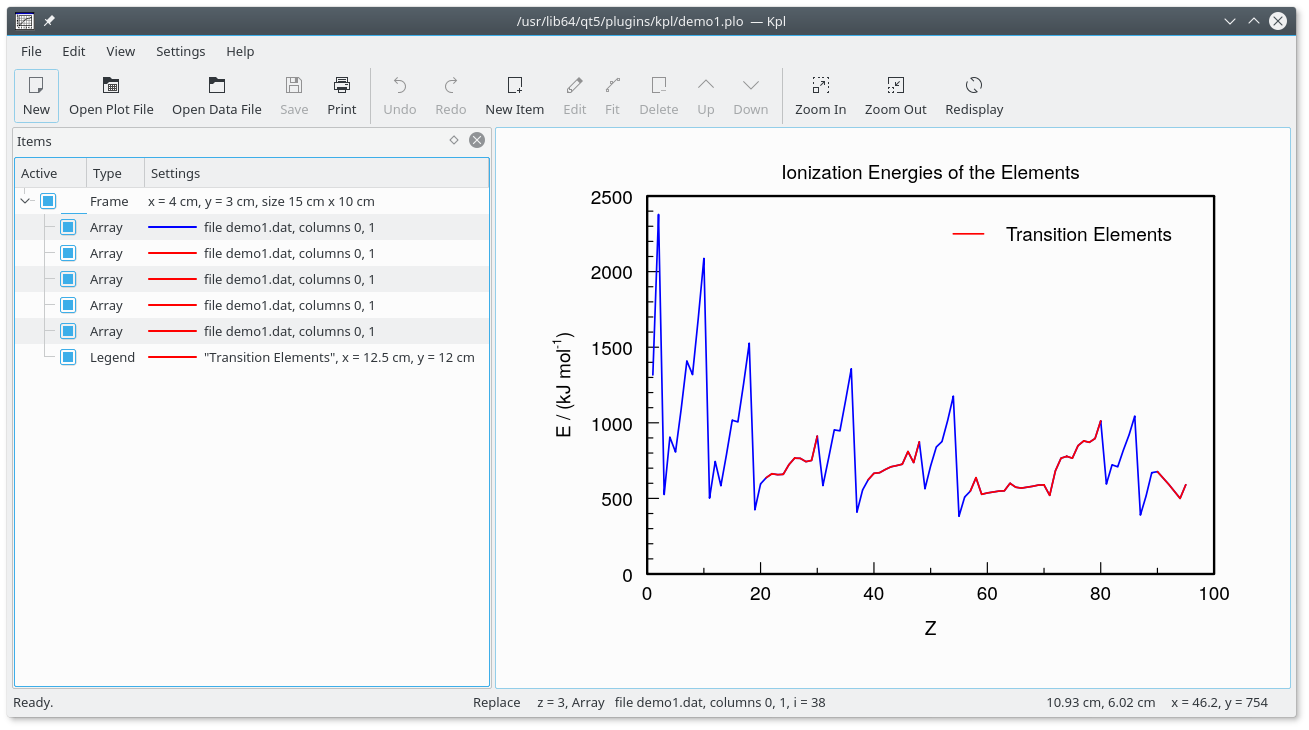
25 years of kpl


Other Science:


Ratings & Comments
7 Comments
Hi , please add ebuild link for Genroo linux system --> https://github.com/mrbitt/mrbit-overlay/blob/master/sci-mathematics/kpl/kpl-5.0.ebuild Thanks :)
oops Gentoo
Thanks for the script! Added to the file section.
A SlackWare TGz package with SlackBuild Script is Ready to DownLoad!!! http://www.slacky.it/ http://www.slacky.it/index.php?option=com_remository&Itemid=1&func=fileinfo&filecatid=878&parent=category
This is a very useful application for scientific and engineering data presentation. I use it for all my reports' diagramms. Thomas
I've been looking for an app like this for ever. 2 comments: The axis-labels print strangely when you add text, and the new-function-function is a bit unwieldy. How do I get it to just draw y=mx+b, or y=ln(x) on my plot without writing dozens of lines of code? Does it do statistics? Regression lines? Error bars? Woohoo!
Very useful for generating a bunch of x-y plots for comparison. I am using it extensively :-) Suggestion (One area of improvement): Like the auto-reload function. It could have been very useful, especially for knowing the state of a running analysis, but its implementation does not seem very efficient (especially for large files, takes a lot of time at 100% cpu consumption).