Hi,
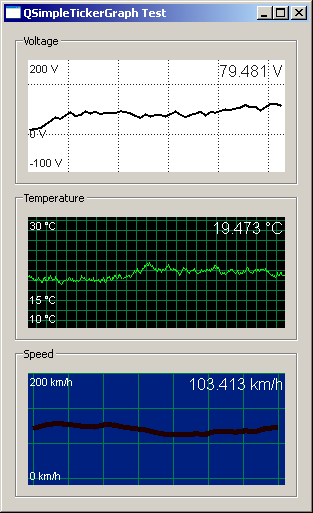
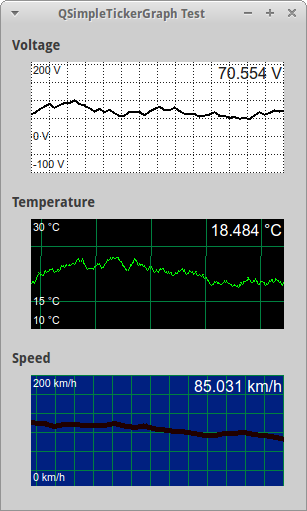
is it possible to plot more than one "data -stream" on one QSimpleTickerGraph? It would be very cool if you could plot an array of values or at least a 2nd value.
An other idea: is it possible to add a function to plot x-axis description and values? As an example the time when the value was recorded (fixed space, no real time measurement or something like that).
Thanks in advance for your response ;-)
Hi Elektrofreak,
Currently, it is not possible to plot more than one "data-stream" on one QSimpleTickerGraph, but I will look into how that could be added as an enhancement. Thanks for the idea!
I also like your idea of adding the ability to plot a description and values on the x-axis. That would probably not be too difficult to add.
Unfortunately, I am pretty busy right now, so I wouldn't expect to be able to add those features very soon, but perhaps in a month I will get a chance to implement them.
Thanks,
Zack
I really like your graph! Very good work! Thank you!
Could you change the grid in a way, that the space between the lines is not in pixels but in the real unit... you understand? setGridPitch(10) should create lines at ...0V, 10V, 20V... in your example, but not all 10 pixels. That would be really great than!


Ratings & Comments
6 Comments
Hi, is it possible to plot more than one "data -stream" on one QSimpleTickerGraph? It would be very cool if you could plot an array of values or at least a 2nd value. An other idea: is it possible to add a function to plot x-axis description and values? As an example the time when the value was recorded (fixed space, no real time measurement or something like that). Thanks in advance for your response ;-)
Hi Elektrofreak, Currently, it is not possible to plot more than one "data-stream" on one QSimpleTickerGraph, but I will look into how that could be added as an enhancement. Thanks for the idea! I also like your idea of adding the ability to plot a description and values on the x-axis. That would probably not be too difficult to add. Unfortunately, I am pretty busy right now, so I wouldn't expect to be able to add those features very soon, but perhaps in a month I will get a chance to implement them. Thanks, Zack
Nice work!! I gonna use it. I need to draw some graphs showing seismology variables. this its a start
I really like your graph! Very good work! Thank you! Could you change the grid in a way, that the space between the lines is not in pixels but in the real unit... you understand? setGridPitch(10) should create lines at ...0V, 10V, 20V... in your example, but not all 10 pixels. That would be really great than!
Thank you! That's a great suggestion. I have now made that change to the widget and uploaded it.
Thank you! I like that!