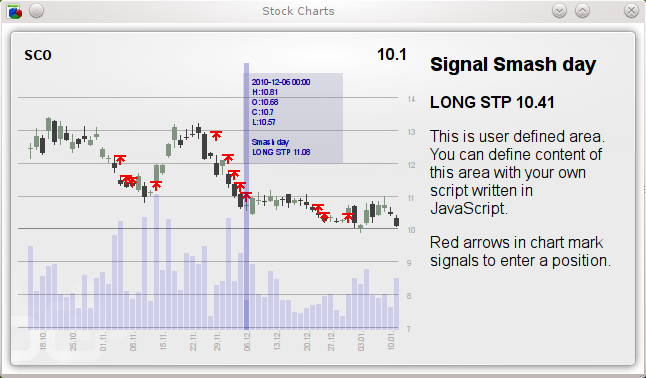
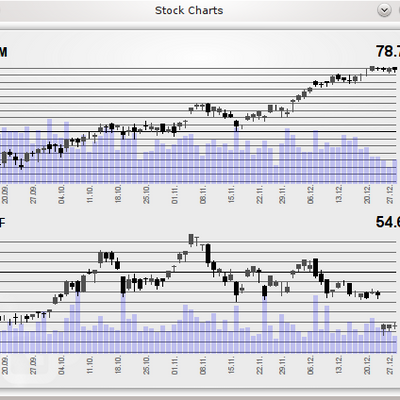
Description: Displays stock quotes on your plasma enabled desktop as a candlesticks charts. Volume is shown as bars under candlesticks chart. There are shown relative values of volume.
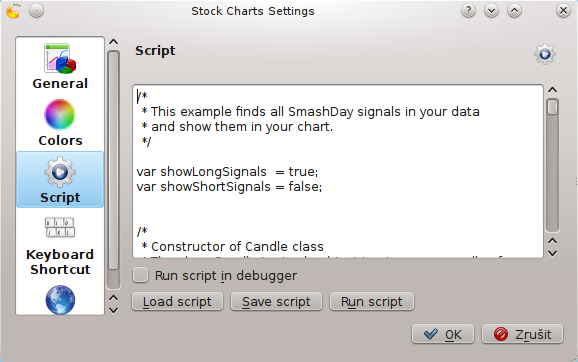
You can write your own JavaScript code to show your trading signals in chart.
Stock quotes are downloaded from ichart.finance.yahoo.com. The quotes are based on daily prices so no live data are shown in the chart. Only historical charts till today are shown.
Not all stocks can be shown in charts. For example, there are no historical data for foreign exchange on finance.yahoo.com so no chart is shown for USD-EUR or other exchange pairs.Last changelog:
0.6 Added scripting to show your own signals in chart. Added graphics cursor showing candle data.


Ratings & Comments
0 Comments